Farmers once depended on field walks and guesswork to judge crop health. That approach misses early stress signals and wastes time across large farms. Satellite crop monitoring changes this completely. It delivers field-wide visibility, early warnings, and data-backed decisions without stepping outside.
Today, satellites help detect plant stress before it becomes visible to the human eye. They measure vegetation strength, soil moisture conditions, and temperature patterns. With the right workflow, even small farms can monitor crops using free satellite data and simple digital tools.
This guide explains exactly how satellite crop monitoring works and how you can apply it step by step. You will learn practical methods, tools, indices, and interpretation strategies that improve yield decisions and reduce risk.
What Does Monitoring Crop Health Using Satellites Mean?
Satellite crop health monitoring uses remote sensing imagery to measure vegetation condition across entire fields. Sensors detect plant reflectance patterns, allowing farmers to identify stress, nutrient gaps, water shortages, pest threats, and growth variations early—before visible symptoms appear—so they can take precise corrective action.
Satellite crop health monitoring uses remote sensing images to evaluate plant vigor, moisture levels, nutrient status, and stress signals across fields. Vegetation indices like NDVI help farmers detect weak zones early, optimize irrigation and fertilizer use, prevent yield losses, and manage crops efficiently without constant physical field inspections.
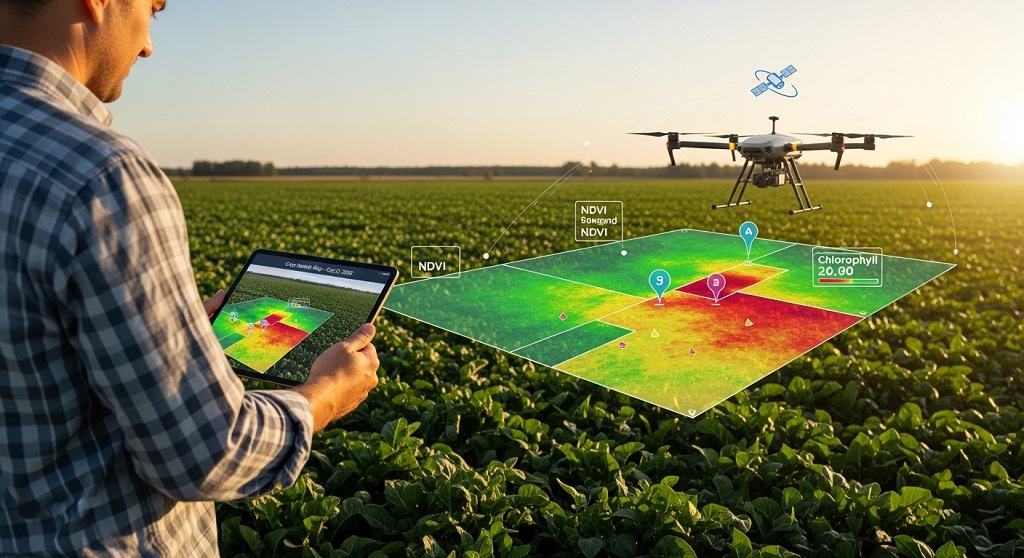
Satellite monitoring works by analyzing reflected sunlight from crop surfaces. Healthy plants reflect light differently than stressed plants. Sensors capture this difference and convert it into vegetation indices.
Instead of inspecting crops manually row by row, farmers receive a full-field health overview. This enables faster diagnosis and targeted treatment.
The method supports:
- Early stress detection
- Water management planning
- Nutrient optimization
- Pest monitoring support
- Yield prediction improvements
Satellite monitoring is especially useful for medium and large farms. However, small farms also benefit through free public imagery sources.
Most modern crop monitoring systems update imagery every 3–5 days. This ensures farmers track changes continuously across the season.
How Do Satellites Detect Crop Stress Before It Becomes Visible?
Satellites detect crop stress by measuring reflectance differences in visible and near-infrared light bands. Healthy vegetation reflects more near-infrared light, while stressed plants reflect less. These variations allow early detection of water shortages, nutrient problems, pest activity, and disease development across fields.
Plants interact with sunlight differently depending on health condition. Chlorophyll absorbs red light but reflects near-infrared wavelengths.
When plants experience stress, chlorophyll levels drop. This alters reflectance patterns. Satellites capture these changes immediately.
This allows farmers to respond before damage spreads.
Common stress indicators detected include:
- Water deficiency
- Nitrogen shortage
- Soil salinity problems
- Fungal disease onset
- Insect infestation zones
Instead of reacting late, farmers intervene early. This reduces fertilizer waste and prevents yield decline.
Precision agriculture systems combine satellite data with weather models. This improves decision accuracy further.
Which Satellite Vegetation Indices Are Used for Crop Monitoring?
Vegetation indices transform satellite reflectance data into crop health indicators. NDVI is the most widely used index, but others like EVI, NDWI, and SAVI provide additional insights into moisture conditions, biomass density, and soil-adjusted vegetation performance across different crop environments.
Vegetation indices simplify interpretation of satellite imagery. They convert raw spectral data into readable crop health values.
| Index | Purpose | Best Use Case |
|---|---|---|
| NDVI | Measures vegetation vigor | General crop monitoring |
| EVI | Improves accuracy in dense crops | Forest or high biomass areas |
| NDWI | Detects plant water stress | Irrigation planning |
| SAVI | Adjusts soil brightness effects | Sparse vegetation zones |
NDVI remains the most widely adopted metric because it works across many crop types.
Farmers compare index values weekly. Declining values indicate emerging stress zones.
Combining multiple indices improves diagnostic accuracy. For example, NDVI detects stress presence while NDWI identifies water-related causes.
What Satellite Platforms Provide Crop Health Data?
Satellite platforms such as Sentinel-2, Landsat-8, and MODIS provide crop monitoring imagery at different resolutions and update frequencies. Free public satellites deliver sufficient accuracy for most farms, while commercial platforms offer higher detail for precision agriculture applications.
Each satellite platform differs in spatial resolution and revisit frequency.
Choosing the right platform depends on farm size and monitoring goals.
Common satellite data sources include:
- Sentinel-2 (10m resolution, free access)
- Landsat-8 (30m resolution, long-term archive)
- MODIS (daily updates, coarse resolution)
- PlanetScope (high-resolution commercial imagery)
Sentinel-2 is ideal for most growers because it balances clarity and update frequency.
Commercial imagery helps detect row-level variation. This supports advanced precision farming strategies.
Historical Landsat data helps compare crop performance across seasons.
How Can Farmers Access Satellite Crop Monitoring Tools Easily?
Farmers can access satellite crop monitoring through digital agriculture platforms that process imagery automatically. Tools like Google Earth Engine, EOSDA Crop Monitoring, and Sentinel Hub provide vegetation maps, stress alerts, and field analytics without requiring technical expertise or specialized hardware.
Modern platforms simplify satellite data interpretation.
Instead of downloading raw imagery, farmers use dashboards that display processed vegetation indices.
Popular crop monitoring platforms include:
- EOSDA Crop Monitoring
- Climate FieldView
- OneSoil
- Sentinel Hub EO Browser
Many platforms provide free trial access or limited-area monitoring.
Farmers upload field boundaries and instantly receive vegetation health maps.
Alerts notify users when vegetation values decline unexpectedly.
This allows quick intervention before yield losses increase.
How Often Should Satellite Crop Monitoring Be Performed?
Satellite crop monitoring should be performed every 3 to 7 days during the growing season. Frequent monitoring helps detect early stress signals, track crop development stages, adjust irrigation schedules, and evaluate fertilizer effectiveness before visible symptoms affect yield performance.
Monitoring frequency depends on crop growth stage.
Early-season monitoring ensures proper emergence.
Mid-season monitoring identifies nutrient gaps.
Late-season monitoring supports harvest planning.
Recommended monitoring schedule:
- Weekly during vegetative stage
- Every 5 days during rapid growth
- Every 3 days during stress-prone weather periods
Cloud cover may delay updates temporarily. However, multiple satellite sources reduce this limitation.
Regular monitoring ensures decisions remain proactive instead of reactive.
How Does Satellite Monitoring Improve Yield and Reduce Costs?
Satellite crop monitoring improves yield by enabling early detection of stress zones and precise resource application. Farmers reduce fertilizer waste, optimize irrigation timing, prevent disease spread, and target treatment areas accurately, resulting in higher productivity and lower operational costs.
Traditional farming applies inputs uniformly across fields.
Satellite monitoring enables variable-rate application.
This improves efficiency significantly.
Key economic benefits include:
- Reduced fertilizer usage
- Lower irrigation costs
- Early pest detection savings
- Improved harvest planning accuracy
Satellite-based decisions prevent over-application of inputs.
This protects soil health and increases long-term productivity.
Yield variability maps also help identify consistently weak zones. Farmers can redesign planting strategies accordingly.
What Steps Should Beginners Follow to Start Monitoring Crop Health Using Satellites?
Beginners should start satellite crop monitoring by mapping field boundaries, selecting a vegetation index like NDVI, reviewing weekly imagery updates, identifying abnormal zones, and applying targeted field inspections to confirm stress causes before adjusting irrigation, fertilization, or pest management strategies.
Starting satellite monitoring requires a simple workflow.
Farmers do not need advanced technical training.
Basic implementation steps include:
- Select a monitoring platform
- Upload farm boundary map
- Review NDVI maps weekly
- Identify low-value vegetation zones
- Inspect those zones physically
- Apply corrective treatment
This approach integrates digital insights with field observation.
Over time, farmers recognize seasonal vegetation patterns. This improves decision speed and accuracy.
Consistent monitoring builds historical performance records that guide future crop planning.
Conclusion: A Practical Solution for Smarter Crop Monitoring
Monitoring crop health using satellites solves one of agriculture’s biggest challenges: detecting stress before yield damage occurs. Instead of relying on guesswork or delayed field inspection, farmers gain continuous visibility across entire farms throughout the growing season.
Satellite imagery reveals hidden crop signals related to moisture stress, nutrient imbalance, pest pressure, and uneven growth zones. These insights allow precise intervention where it matters most. As a result, farmers reduce input waste, improve productivity, and strengthen long-term soil performance.
Even better, many satellite platforms now provide free access to vegetation indices like NDVI. This makes advanced crop intelligence available to farms of all sizes. With just weekly monitoring and targeted field validation, growers can transform decision-making from reactive to proactive.
If you want stronger yields and better resource efficiency, start using satellite crop monitoring this season. Choose a platform, map your fields, and review vegetation updates regularly. Small adjustments based on satellite insights can produce major improvements at harvest time.
FAQ: How to Monitor Crop Health Using Satellites
Is satellite crop monitoring accurate for small farms?
Yes. Platforms like Sentinel-2 provide 10-meter resolution imagery, which is accurate enough for most small farms. Farmers can detect stress zones, track vegetation growth patterns, and identify irrigation problems without expensive equipment or field sensors.
Can satellite imagery detect crop disease early?
Satellite imagery cannot identify specific diseases directly but detects vegetation stress patterns caused by disease. Early detection allows farmers to inspect affected zones quickly and apply treatment before damage spreads across the field.
Is NDVI enough for crop monitoring?
NDVI is sufficient for general crop health monitoring. However, combining NDWI and SAVI improves diagnostic accuracy by identifying moisture stress and soil-related vegetation variability across different crop environments.
How frequently are satellite images updated?
Most public satellite systems update imagery every 3 to 5 days. Commercial providers may offer daily updates. Frequent updates help farmers track rapid vegetation changes during critical growth stages.
Do farmers need special software to analyze satellite data?
No. Many platforms process satellite imagery automatically. Farmers only need internet access and field boundary maps to start monitoring vegetation indices through online dashboards.
Can satellite monitoring reduce fertilizer costs?
Yes. Satellite maps identify weak vegetation zones precisely. Farmers apply fertilizer only where needed instead of across entire fields, reducing waste and improving nutrient efficiency.
Is satellite crop monitoring useful for all crop types?
Yes. Satellite vegetation indices work across cereals, vegetables, orchards, and plantation crops. Monitoring accuracy depends mainly on spatial resolution and update frequency rather than crop species.
Read More Also: What to Anticipate When Receiving Microneedling for Stretch Marks